Pollutants in Terrassa
Hey there, in this project we analyzed and manipulated over 3 million data of pollution in Terrassa, a city of Spain located near Sabadell.
We used a program called RStudio which allows us to use R, a programming language for the making of graphics and statistics.
After using the codes provided by our teacher, we managed to make some. Now, i will explain a little bit the graphics below. You can zoom the image by clicking on it.
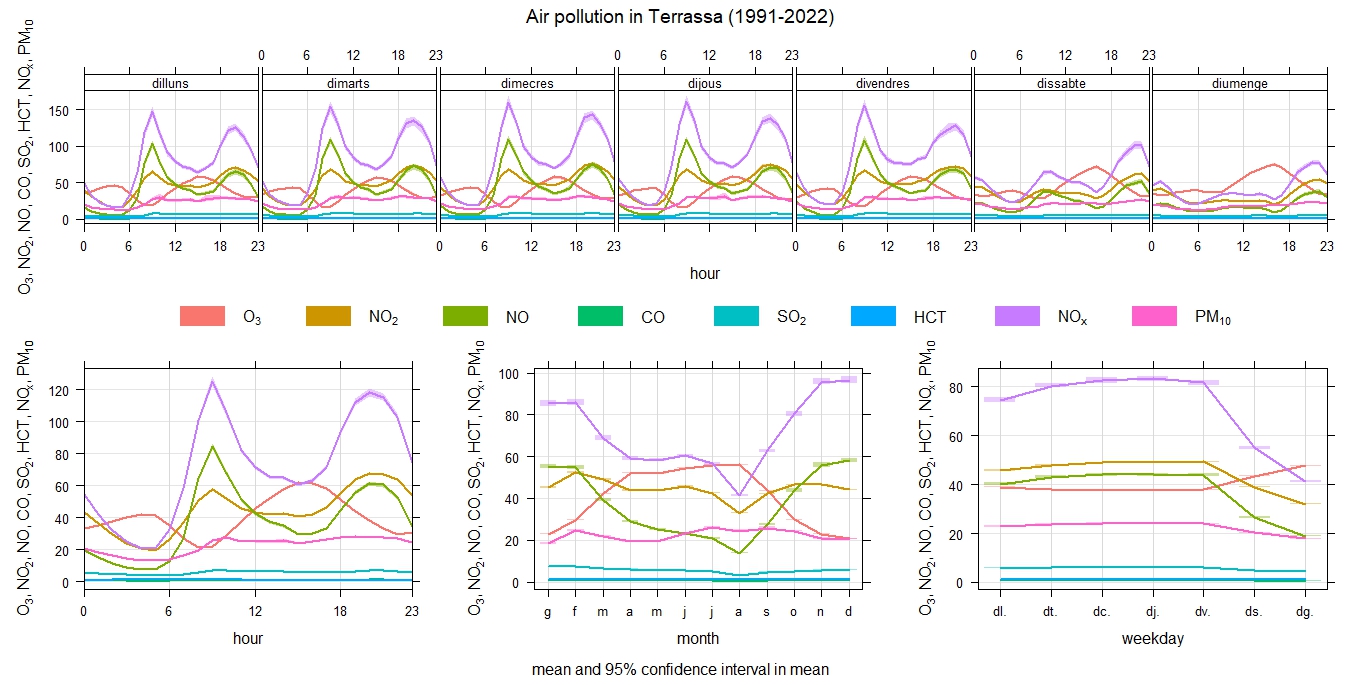
In this graphic we can see that the pollution is lower at the weekends. Maybe it is due to people not using transport to go to work, which pollutes the air or could be some factories does not work either in weekends.
What contaminants are lower?
The NOX, a group of highly reactive gases [such as nitric oxide (NO) and nitrogen dioxide (NO2)] that contain nitrogen and oxygen in various proportions.
The pm10 are particles which it's size is 10 micrometres or lower.
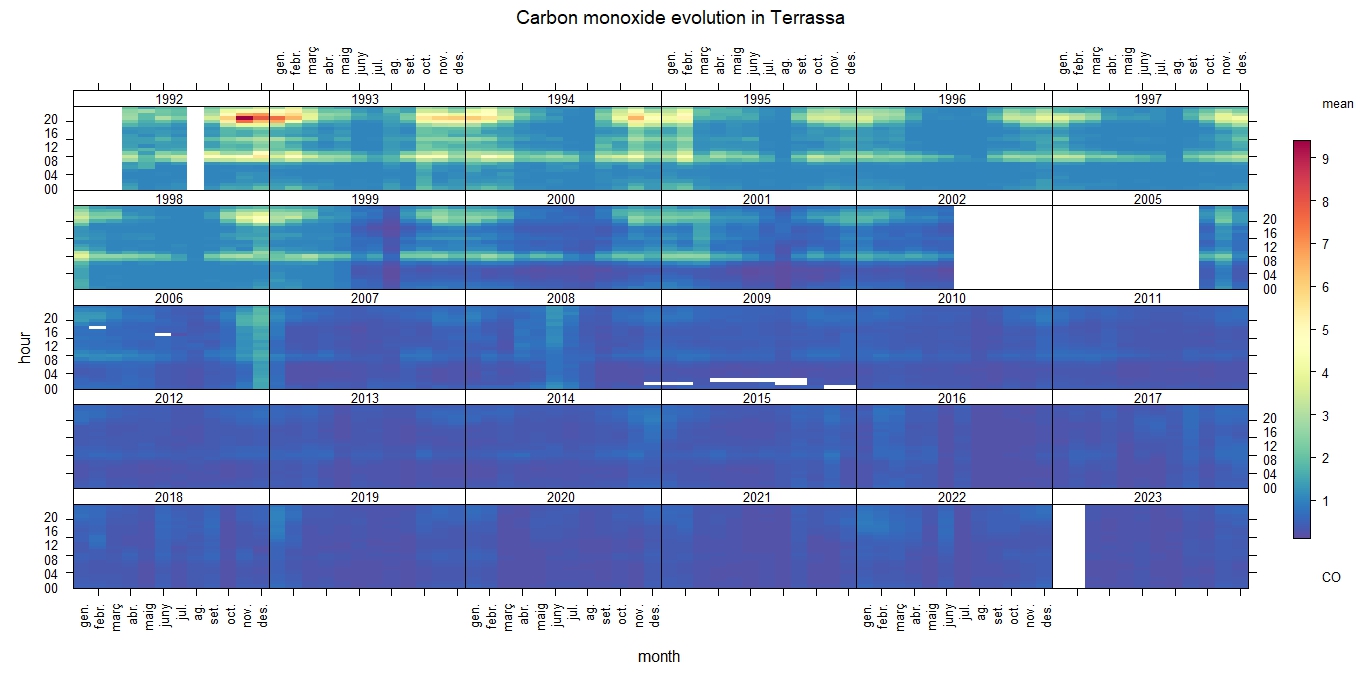
I will explain what happened during the years for the carbon monoxide in Terrassa.
As you can see, between 1992-2006, on the graphic there are parts which are yellow, could be a 5-6 in the mean but, not as the red one which is located between 1992 & 1993 with a mean of +9.
What happened?
I didn't manage to find information on internet, but the sudden increase of this compound could be the result of a factory in function or some several gas leakage as the color is red.
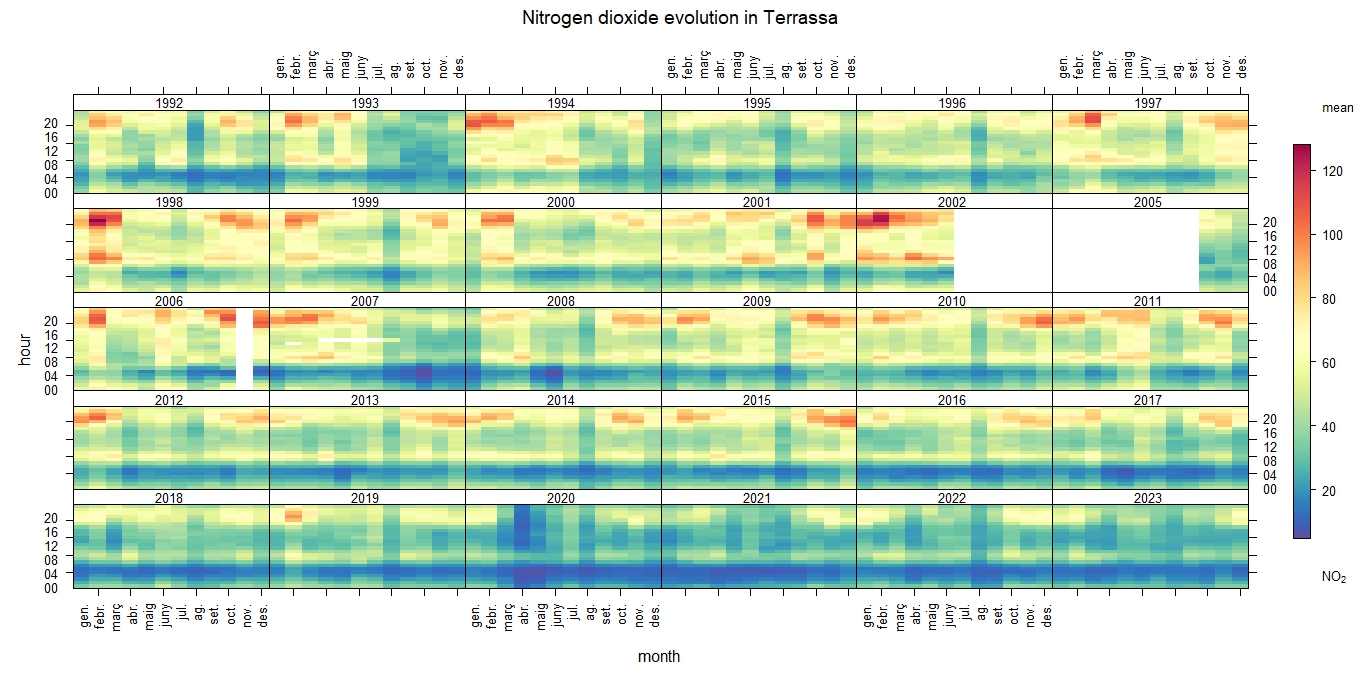
I will explain what happened during the years for the nitrogen dioxide in Terrassa.
What happened?
In this case, the mean of NO2 is very irregular with some peaks of pollution in different years, from 1992-2020 people where using this compound. After 2020 thers is no more peaks.
Maybe thats the result of a prohibition or the closure of factories.
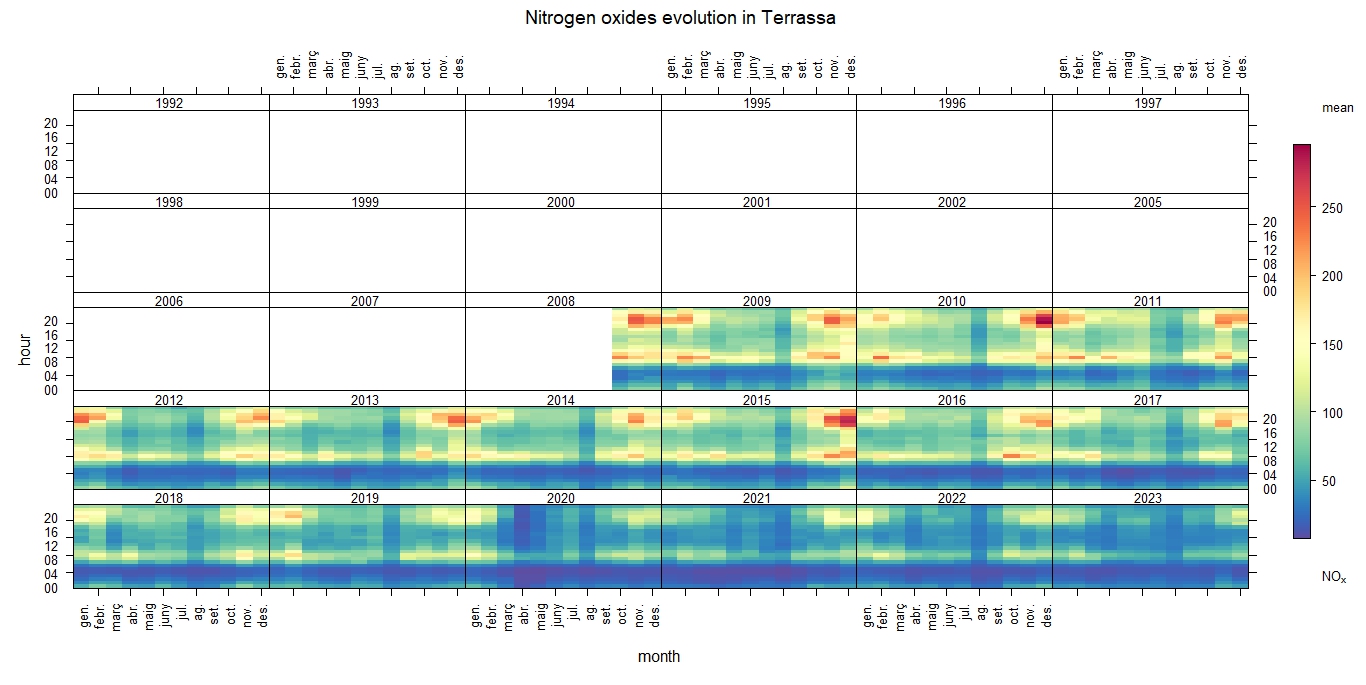
I will explain what happened during the years for the nitrogen oxide in Terrassa.
In this graphic, we can observe that there are no information of nitrogen oxide during 1992 and 3/4 part of 2008.
What happened?
This means that there was no device of measuring in that time so, half of the graphic is blank.
After half term of 2008, the city hall may installed some devices and started capturing and measuring the levels of the NOx.
We can see that the levels of NOx are higher during january & december. Probably in that days, someone was trying to do some experiments with this compound.
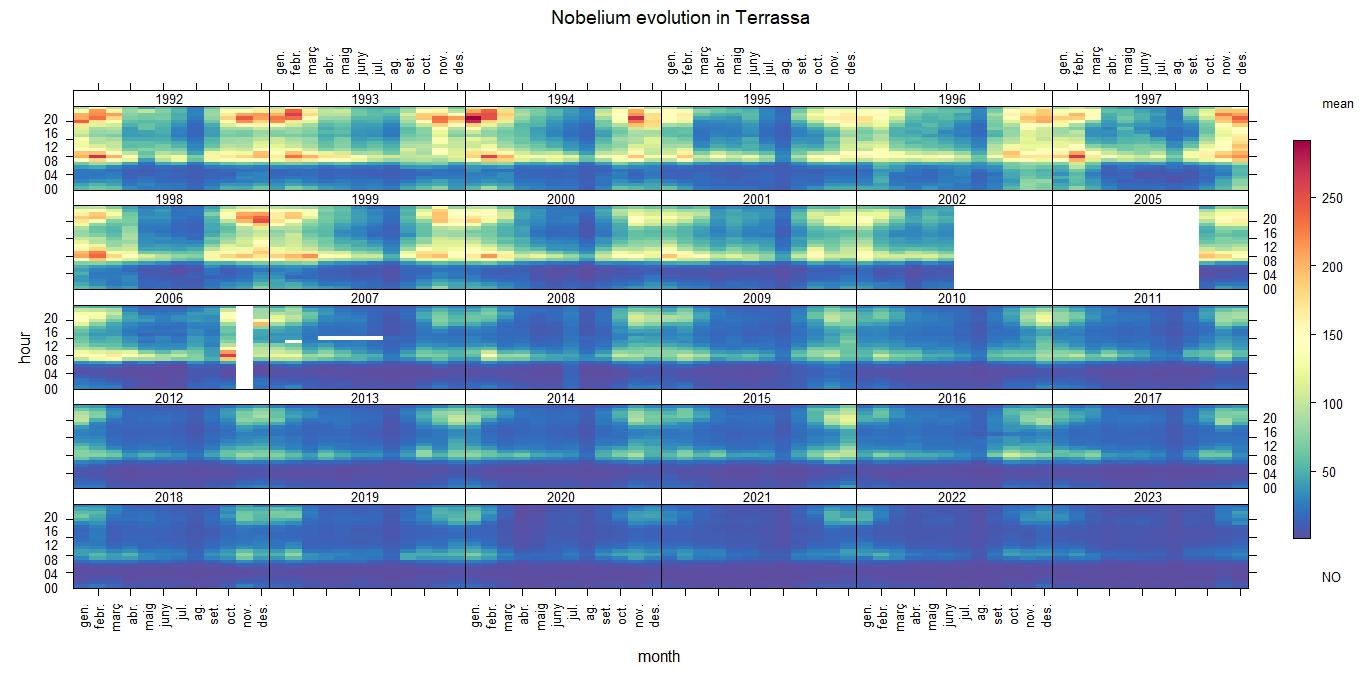
I will explain what happened during the years for the nobelium in Terrassa.
Nobelium is a radioactive metal and is not found naturally on Earth instead, it is produced artificially in nuclear reactors or particle accelerators.
What happened?
At the beggining of the graphic, scientifics were using this artificial component. Nobelium is highly radioactive and has no practical applications outside of scientific research,
particularly in the fields of nuclear physics and chemistry.
Probably during 1992-2006 scientists were using it. After 2006 the pollutant decrease significantly.
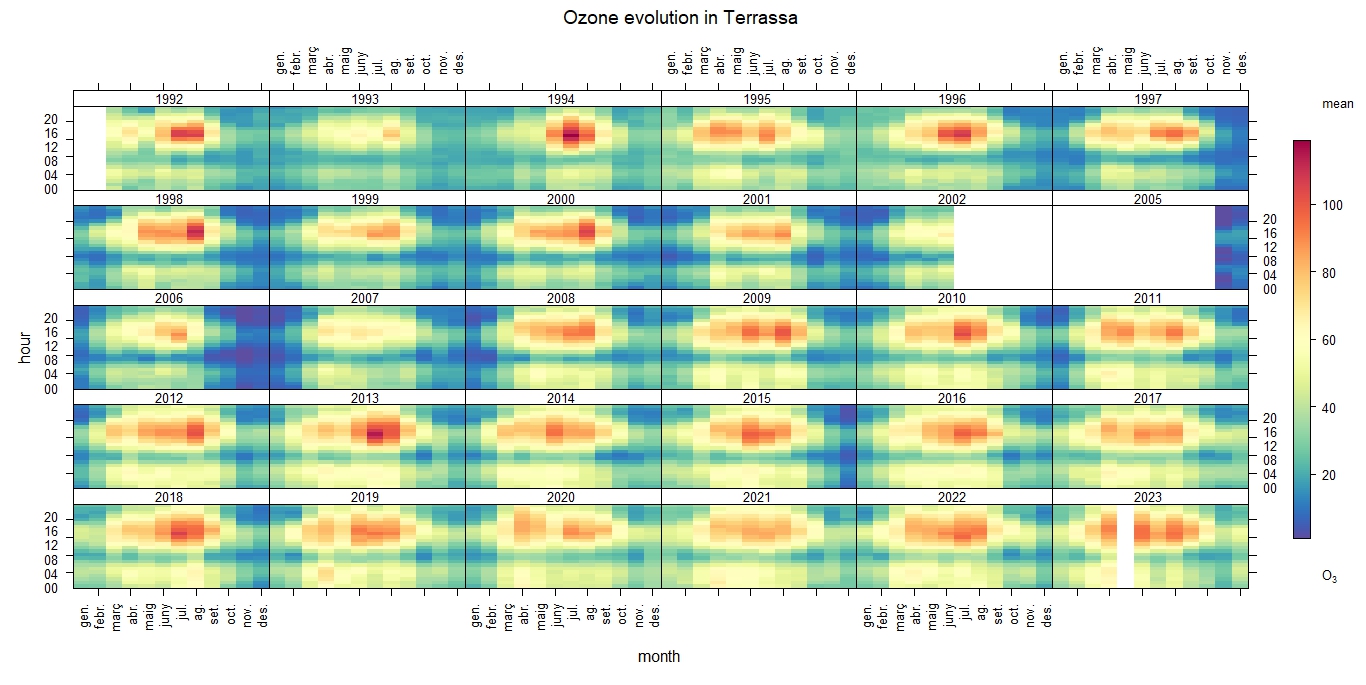
I will explain what happened during the years for the ozone in Terrassa.
Ozone is a gas molecule composed of three oxygen atoms. It is naturally present in Earth's atmosphere, primarily in the stratosphere, where it forms the ozone layer.
What happened?
The concentration of ozone in the Earth tends to be higher during the summer months because of the sunlight increase, also people in summer goes to vacations so,
the concentration of vehicles is much higher as the car needs to burn fuel.
The number is quite similar between all the years
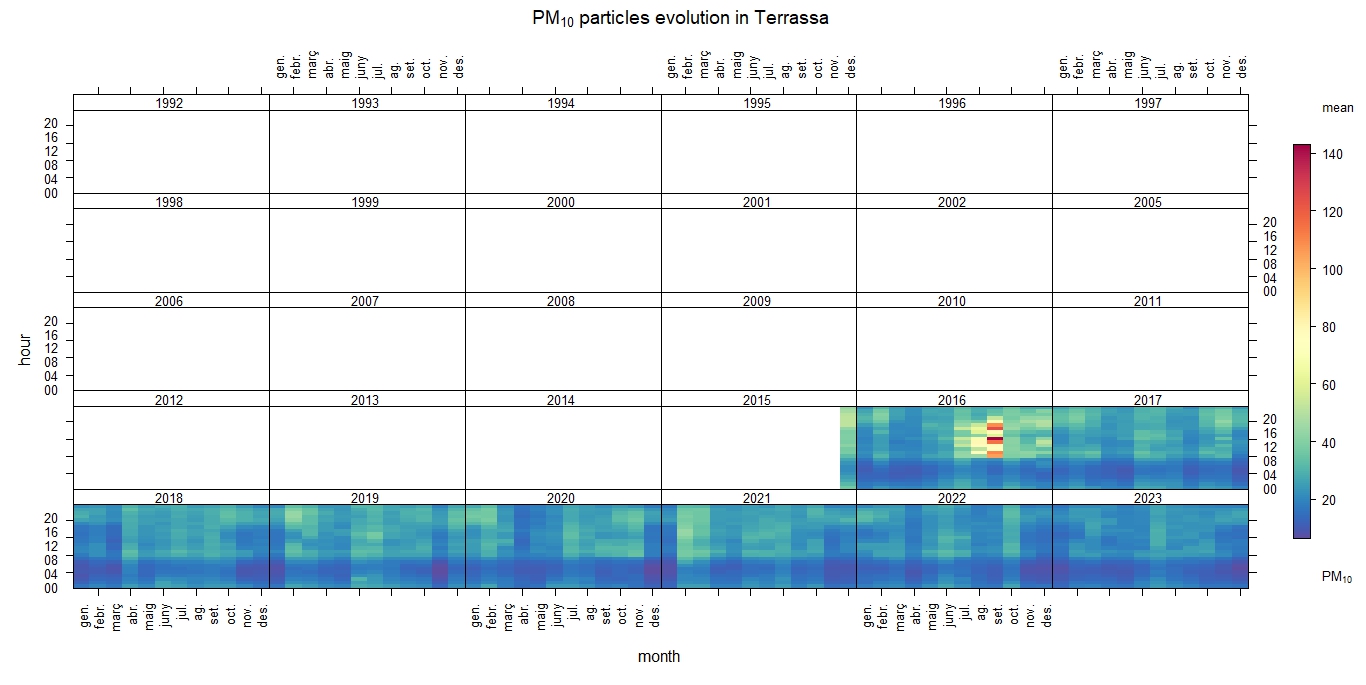
I will explain what happened during the years for the pm10 particles in Terrassa.
This graphic is similar to the NOx one, because there was no information before at the end of 2015.
As I said before, pm10 are particles wich it's size is 10 micrometers or less.
What happened?
In September at 8, 12, 16 hours we can apriciate some peaks of pm10 particles.
Due to the climate, it can trap pollutants close to the ground, leading to an accumulation of particulates.
Another one's are traffic emissions, high population density or high industrial activities.
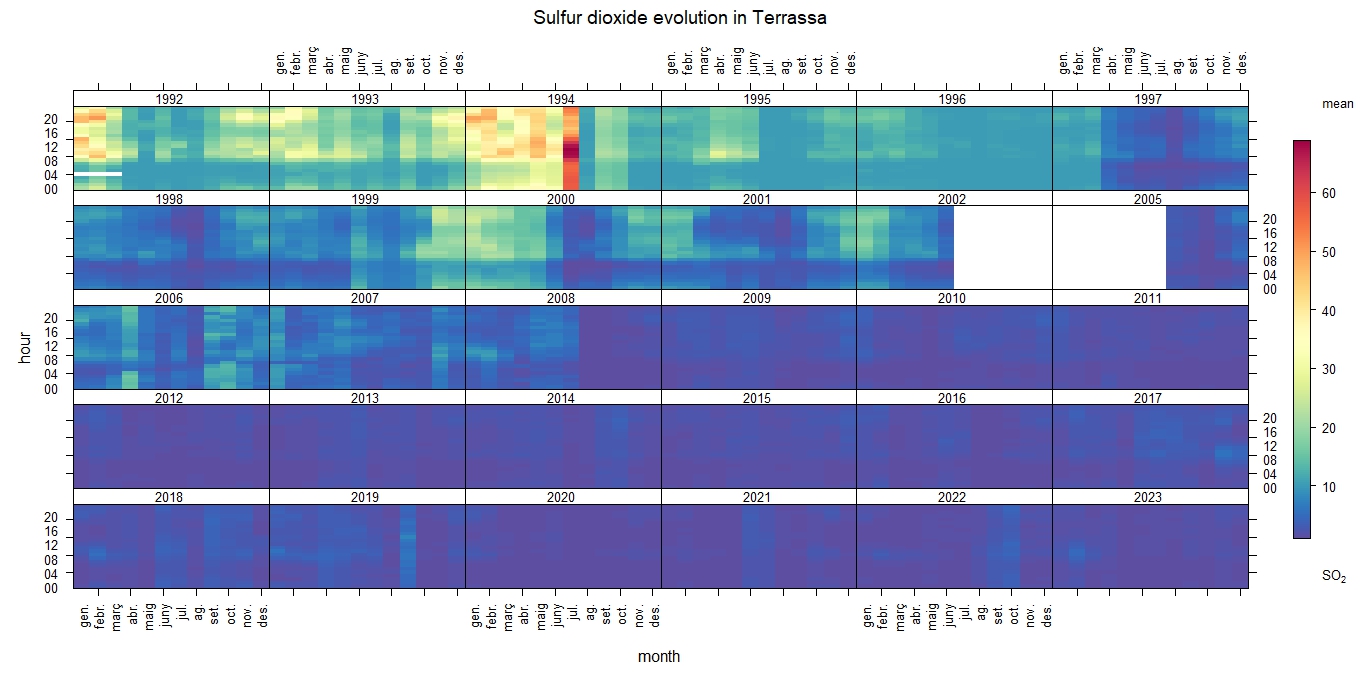
I will explain what happened during the years for the sulfur dioxide in Terrassa.
It is produced primarily by burning fossil fuels containing sulfur, such as coal and oil, and industrial processes like smelting metal ores.
What happened?
After doing some research, I got an conclusion to this, the peak on July in 1994, is because industrial activities, maybe a lot of factories were funcioning at the same time or they were producing tons of products.